The climate risk tool
for coastal areas
Handen houden een tablet vast met het Climate Risk Dashboard van Van Oord, waarop een Europese kaart met oranje gemarkeerde klimaatrisico's zichtbaar is.
Van Oord
Client
3 weeks
of design and development
862.000
km2 flood risk area
2021
Launched at Climate Adaptation Summit
What we did
UX Research
UX Design
UI Design
Templates

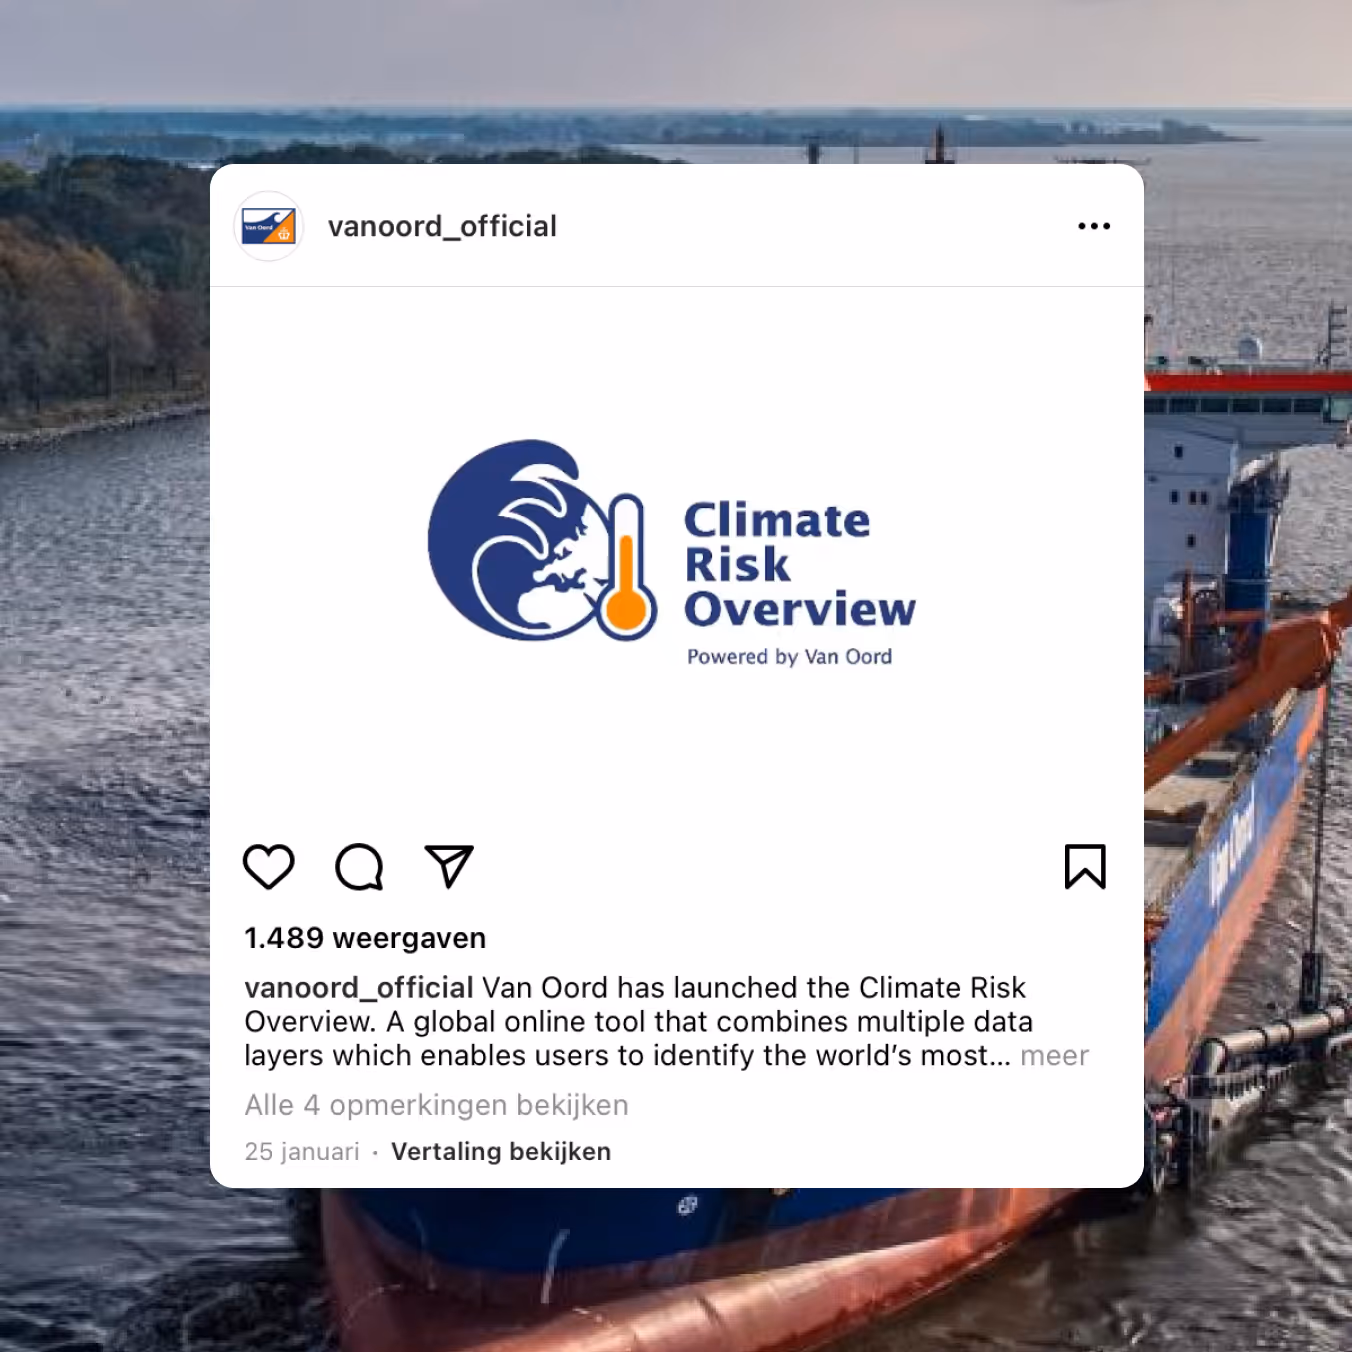
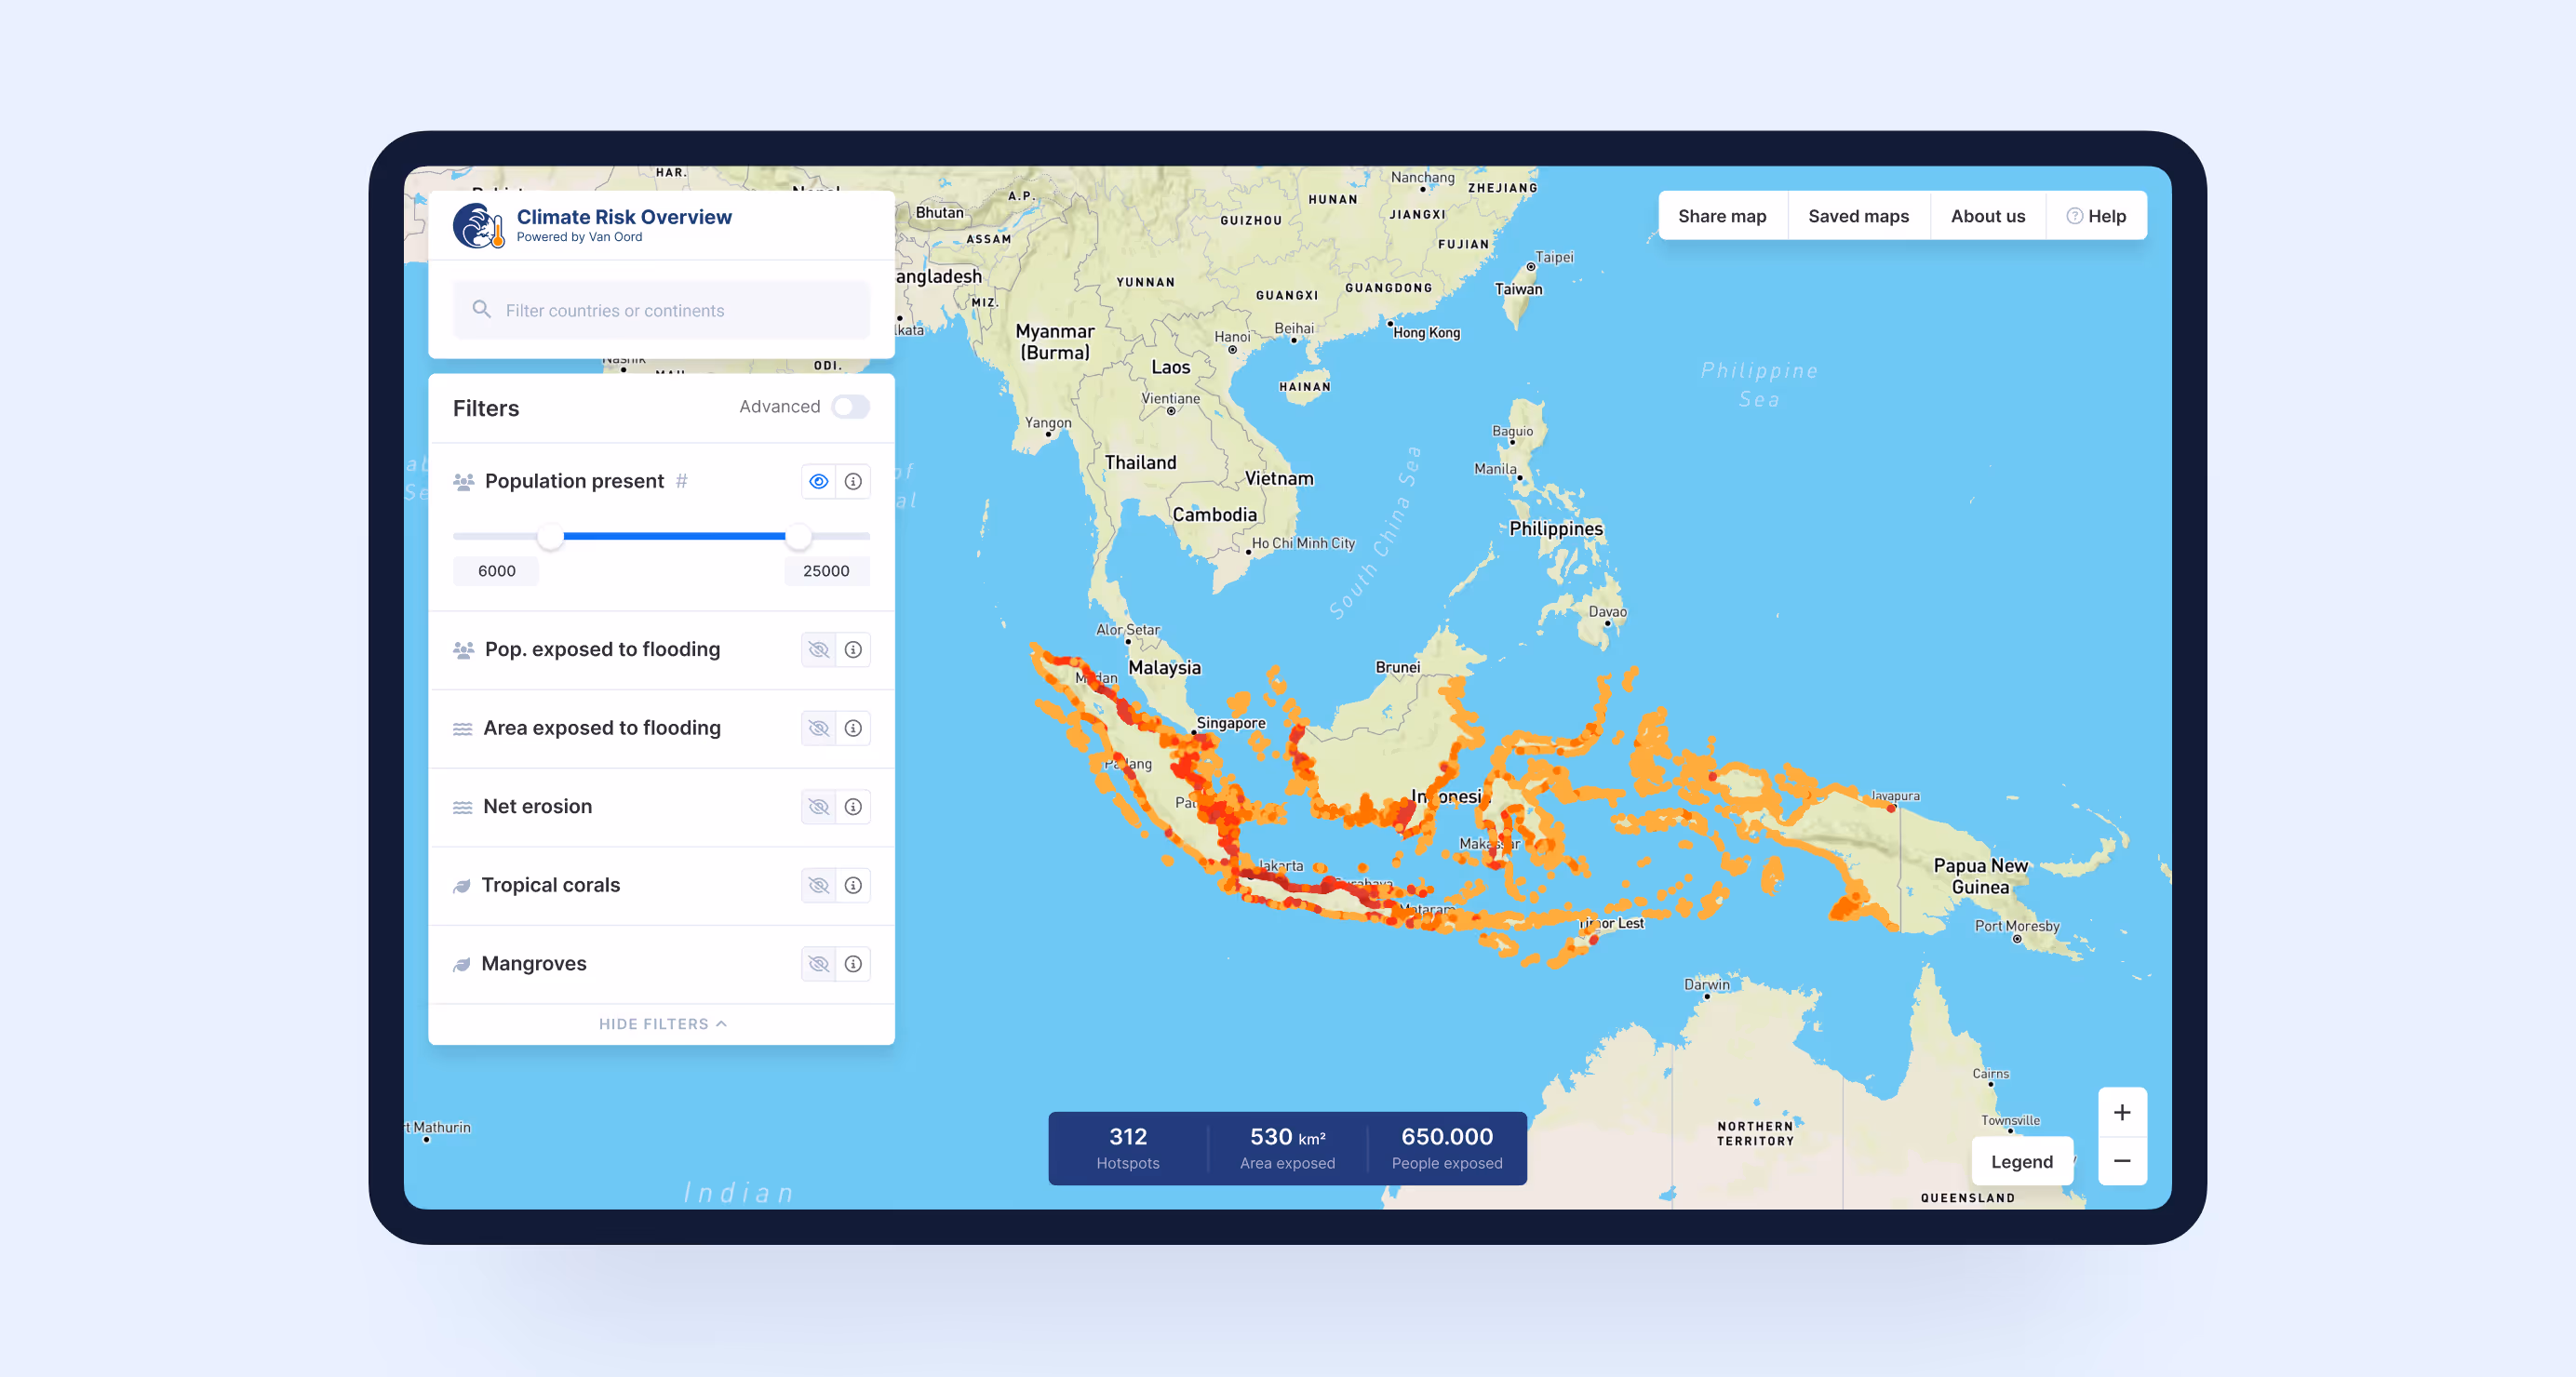
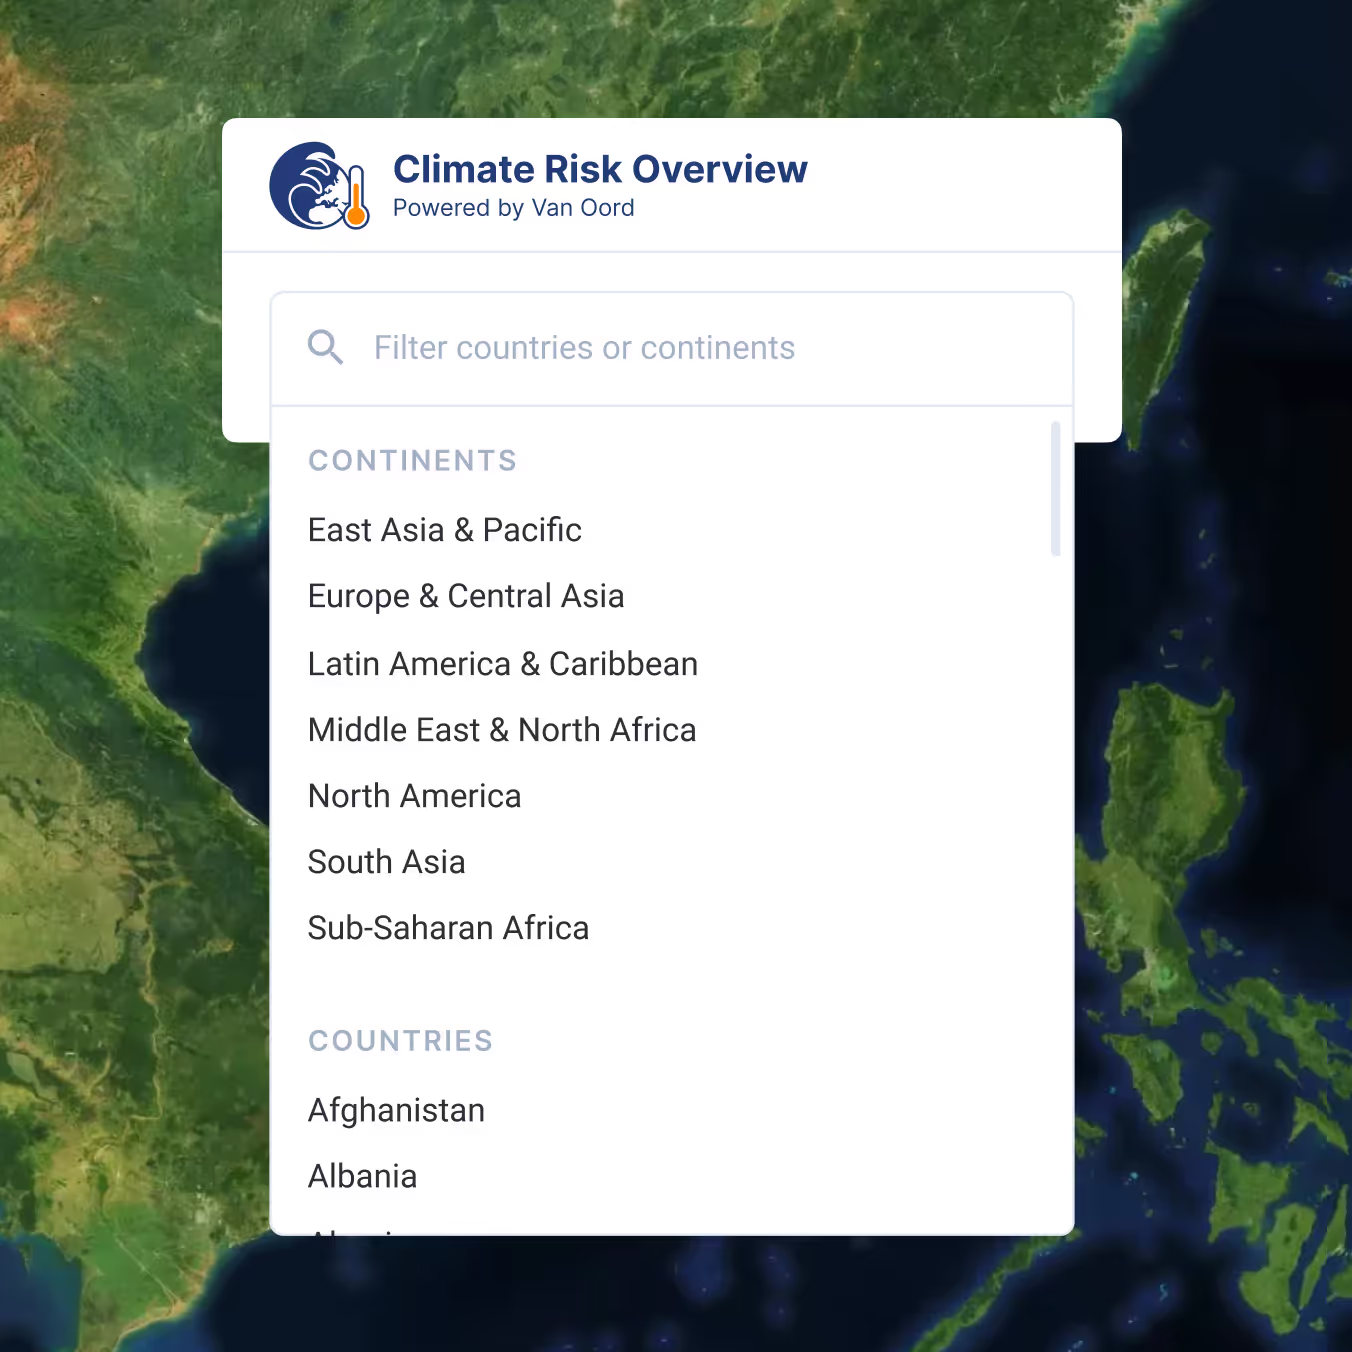
Van Oord, a leading international engineering company, has developed the Climate Risk Overview, a groundbreaking tool that provides insight into global climate risks. This tool is freely accessible and provides an in-depth overview of how rising sea levels and other climate changes are affecting coastlines and areas around the world. Van Oord asked us to design the tool's interface so that it is not only intuitive and user-friendly, but also looks professional and reliable.

Climate Risk Overview dashboard toont Indonesie en Zuidoost-Azie met oranje gemarkeerde klimaatrisico-zones van het Van Oord platform.
Filtermenu van het Climate Risk Overview met mondiale kaartweergave en selectieopties voor continenten en landen voor risicoanalyse.Climate Risk Overview-interface met gefilterde Europese kaart op bevolkingsgegevens, grafiek en interactieve schuifbalk voor populatieanalyse.
The Climate Risk Overview: Easy, Fast and Accessible

In close collaboration with the Van Oord project team, we identified the core needs of the users and set priorities to be the first to develop the most valuable features.

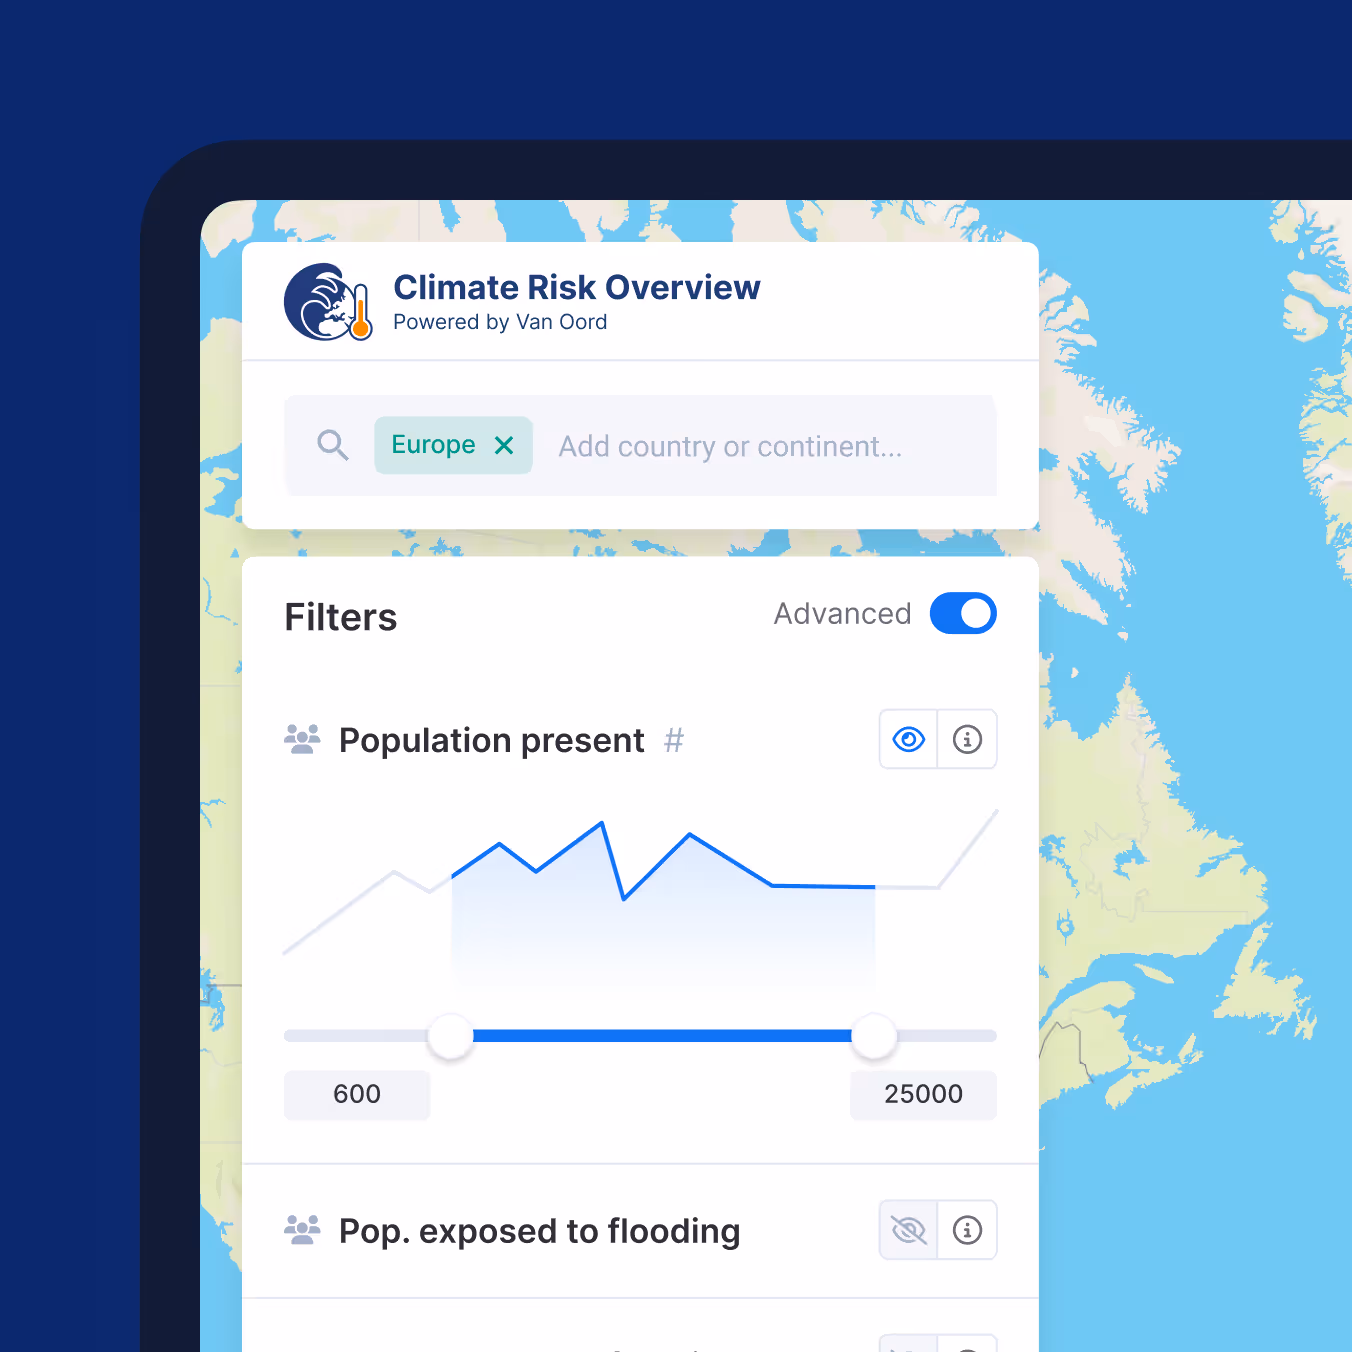
Thanks to a fast and flexible approach (sprints), we were able to design the tool within three weeks. We focused on improving usability by implementing a clear visual style that seamlessly matches Van Oord's corporate identity.

One of the innovative solutions we implemented was to show an onboarding screen while the map data was loading, which turned the waiting time into a useful introduction to the tool.

Modaal informatievenster van Climate Risk Overview toont details over kwetsbare kustlijnen en gegevensvisualisatie voor klimaatrisico's.
Meerdere interfacepanelen van Climate Risk Overview met filters, statistieken (312 hotspots, 530 km², 650.000 mensen) en kaart-deelfunctionaliteit.
Outcome

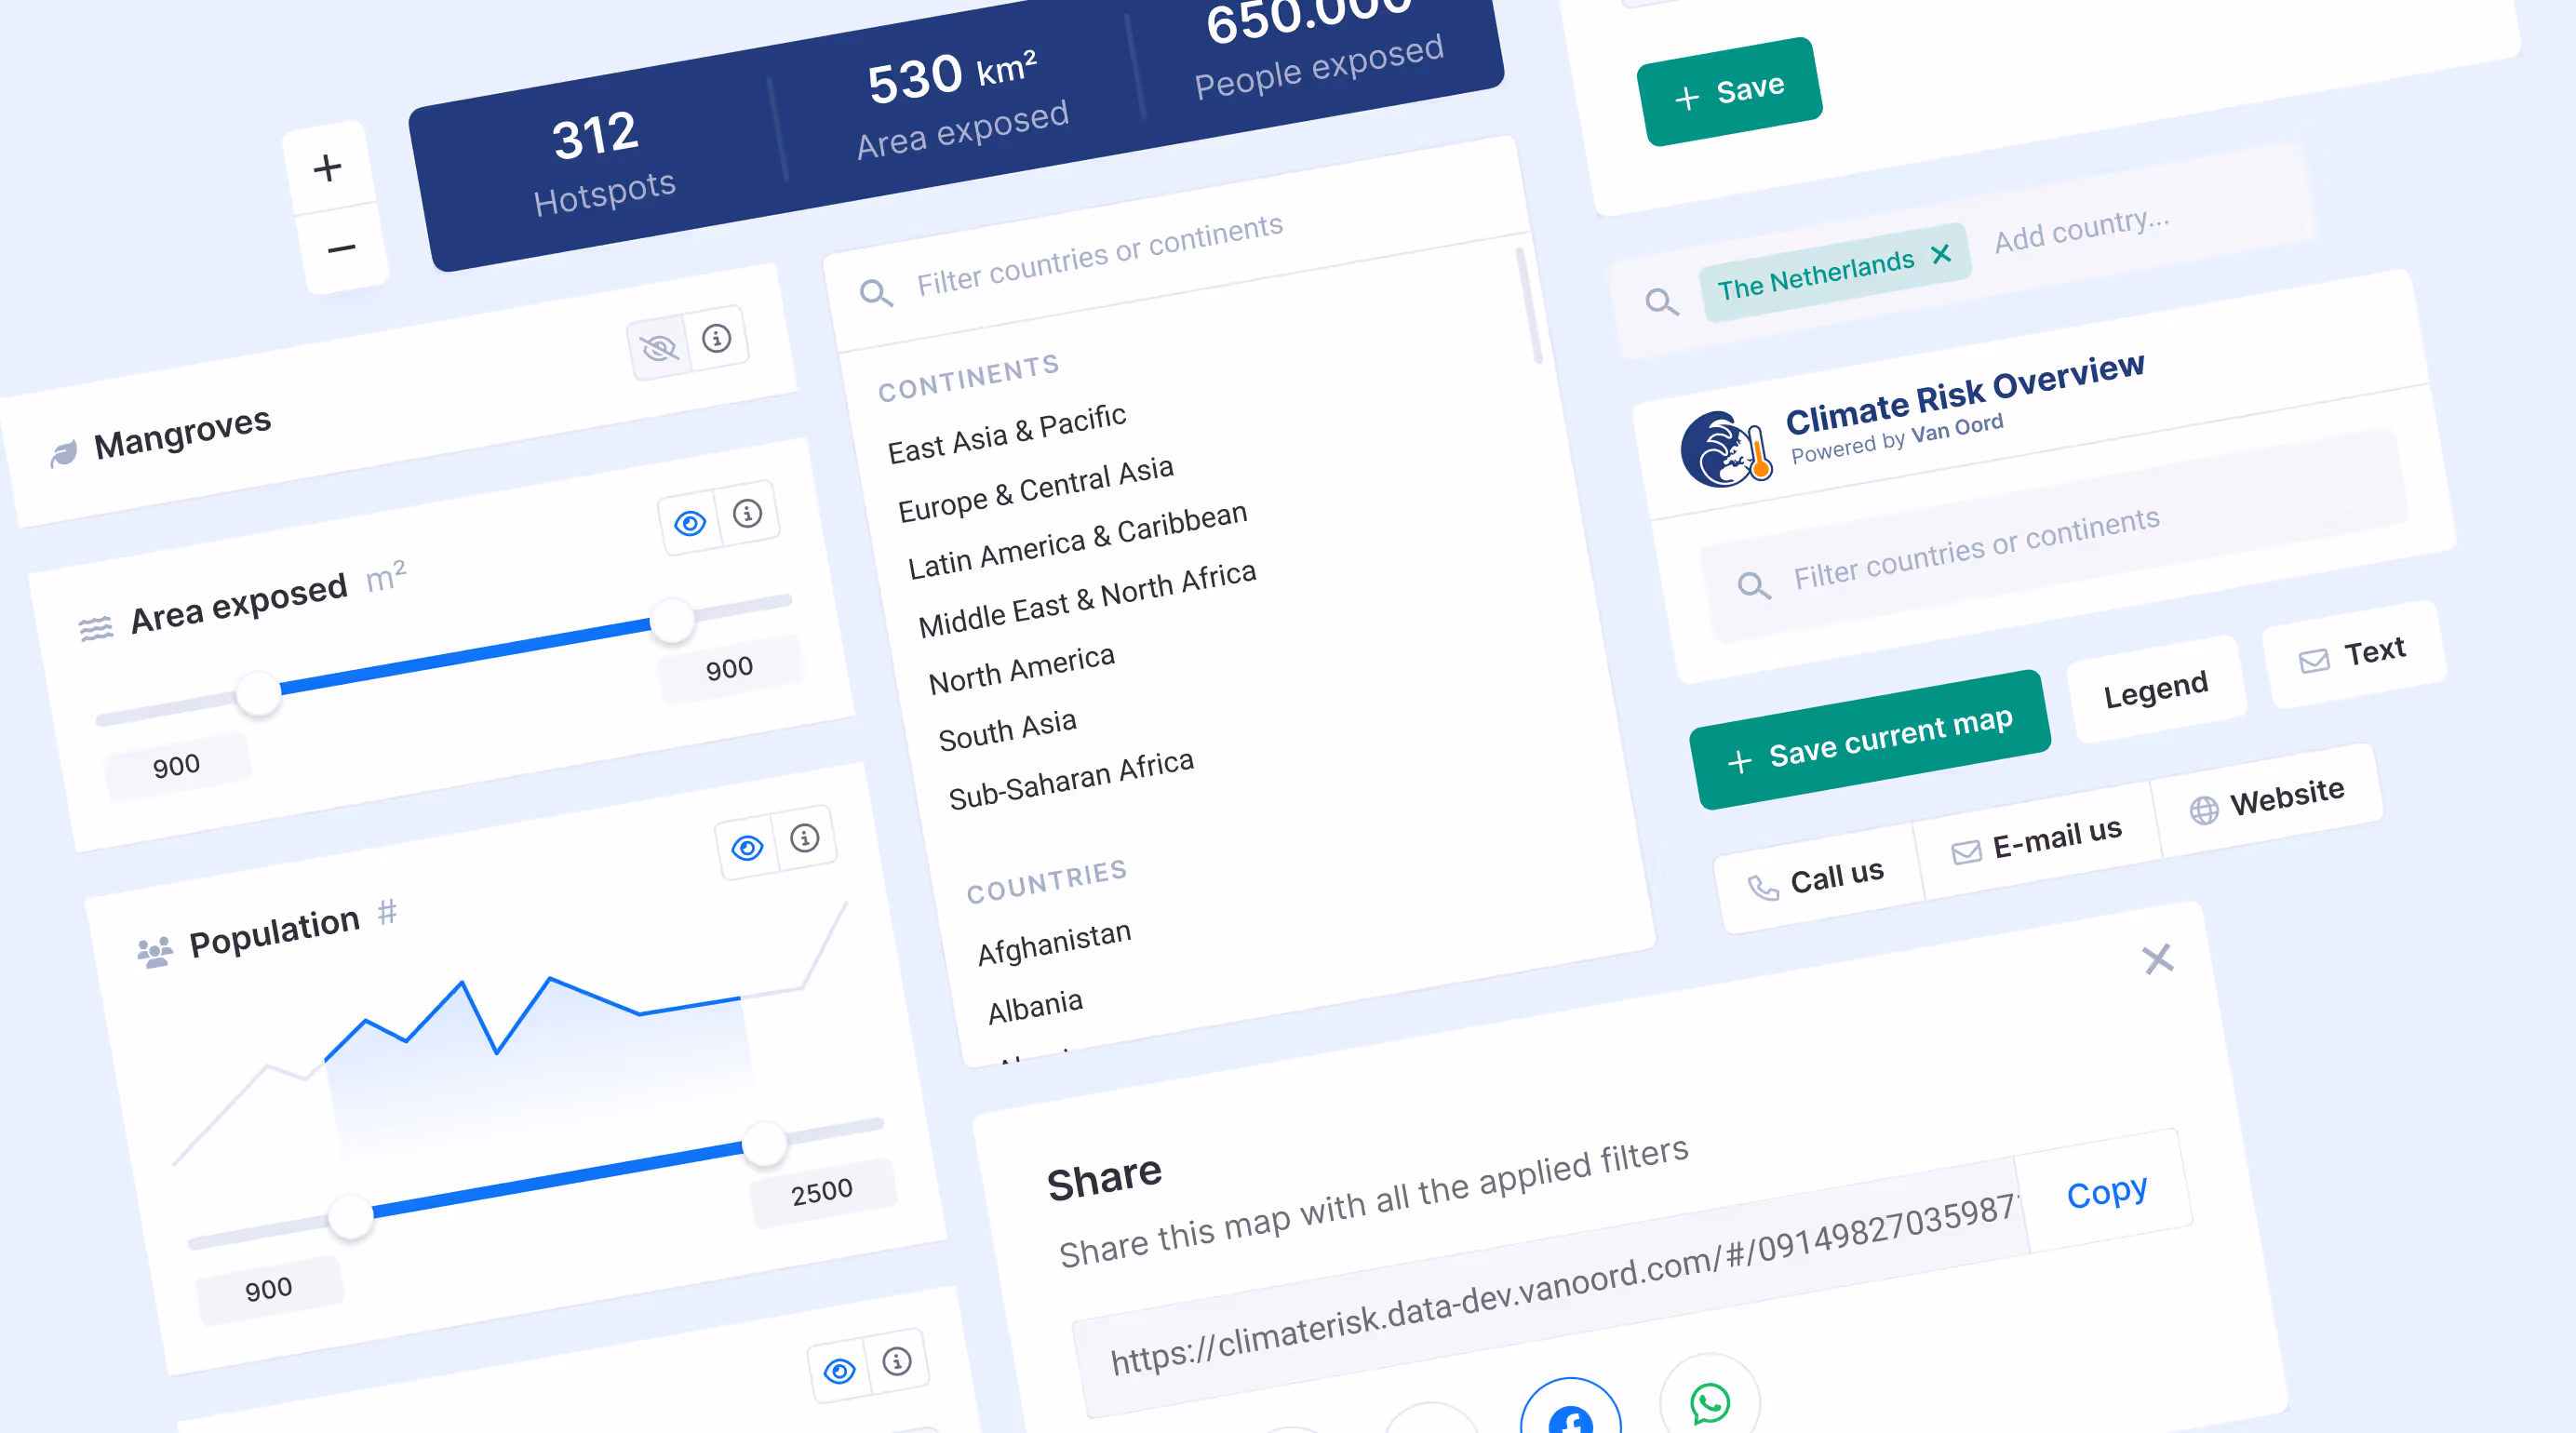
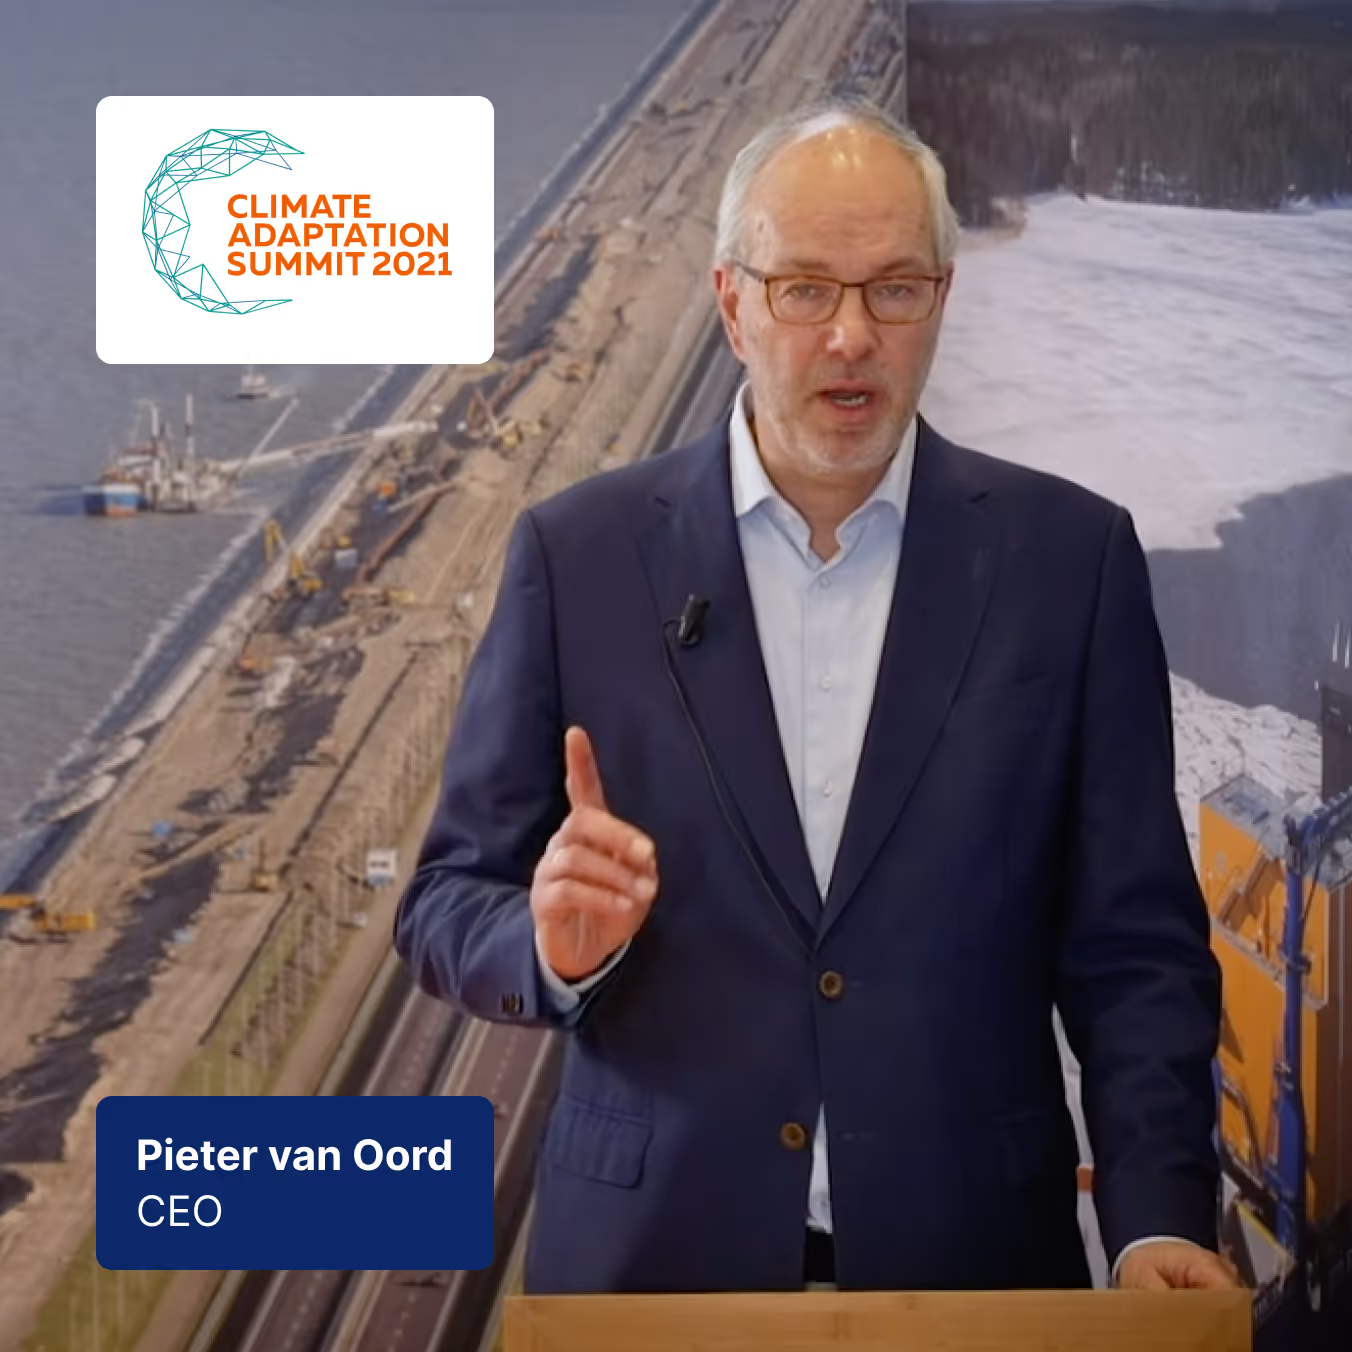
The result was an easy-to-use, world-class tool that was successfully launched at the Climate Adaptation Summit and later officially presented to the United Nations. This tool enables Van Oord to share its knowledge and expertise worldwide while raising awareness about climate risks.

Pieter van Oord, CEO van Van Oord, presenteert op de Climate Adaptation Summit 2021 met een dijk en bouwmachines op de achtergrond.Instagram-post van Van Oord over het Climate Risk Overview platform met zicht op een schip in de haven op de achtergrond.
Want to design an impactful app too?
Close Cookie Popup
Cookie preferences
By clicking “Accept All”, you agree to the storage of cookies on your device to improve site navigation, analyze site usage, and assist with our marketing efforts, as described in our privacy policy.
Necessary (always active)
Cookies that are necessary to enable the basic functionality of the website.
Cookies that are used to understand how the website is performing and whether there may be technical issues.
Cookies used to display ads that are relevant to your interests.
Cookies that allow the website to remember choices you make (such as your user name, language, or region you are in).
Portretfoto van Koen, Digital Director bij Evers + de Gier
Portretfoto Ferry met krullend donker haar, bril en groen fleece jasje, lachend omhoog kijkend
Portretfoto van Mans van der Drift, designer bij Evers + de Gier
Get to know us

Have a great idea, a question, or just want to know who we are? Get in touch.

Get in touch
And tell us about your idea